Use the following
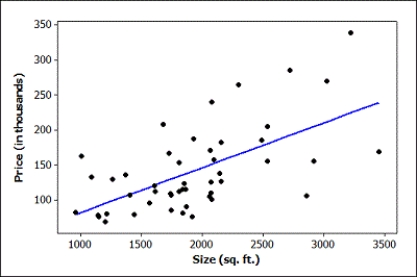
A quantitatively savvy, young couple is interested in purchasing a home in northern New York. They collected data on 48 houses that had recently sold in the area. They want to predict the selling price of homes (in thousands of dollars) based on the size of the home (in square feet).
The regression equation is Price (in thousands) = 17.1 + 0.0643 Size (sq. ft.)

S = 48.5733 R-Sq = 37.5% R-Sq(adj) = 36.1%
Predicted Values for New Observations

-Construct and interpret a 95% confidence interval for the population slope.
Correct Answer:
Verified
0.0643
View Answer
Unlock this answer now
Get Access to more Verified Answers free of charge
Q97: Use the following
A quantitatively savvy, young
Q98: Use the following
A quantitatively savvy, young
Q99: Use the following
A quantitatively savvy, young
Q100: Use the following
A quantitatively savvy, young
Q101: Use the following
A quantitatively savvy, young
Q103: Use the following
A quantitatively savvy, young
Q104: Use the following
A quantitatively savvy, young
Q105: Use the following
A quantitatively savvy, young
Q106: Use the following
A quantitatively savvy, young
Q107: Use the following
A quantitatively savvy, young
Unlock this Answer For Free Now!
View this answer and more for free by performing one of the following actions

Scan the QR code to install the App and get 2 free unlocks

Unlock quizzes for free by uploading documents