Use the following
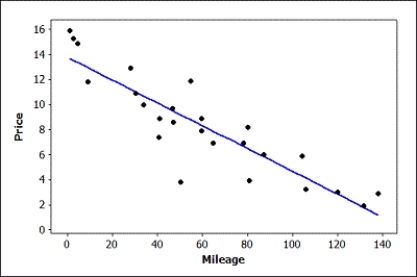
Data were collected on the mileage (in thousands of miles) and price (in thousands of dollars) of a random sample of used Hyundai Elantras. A scatterplot of the data (with regression line), some summary statistics, and partial computer output from a regression analysis are provided.
Use three decimal places when reporting the results from any calculations, unless otherwise specified.

The regression equation is Price = 13.8 - 0.0912 Mileage

-Use the provided output to construct and interpret a 95% interval for the mean price of all used Hyundai Elantras with 50,000 miles.
Correct Answer:
Verified
View Answer
Unlock this answer now
Get Access to more Verified Answers free of charge
Q53: Use the following
Data were collected on the
Q54: Use the following
Data were collected on the
Q55: Use the following
Data were collected on the
Q56: Use the following
Data were collected on the
Q57: Use the following
Data were collected on the
Q59: Use the following
Data were collected on the
Q60: Use the following
Data were collected on the
Q61: Use the following
Data were collected on the
Q62: Use the following
Data were collected on the
Q63: Use the following
Data were collected on the
Unlock this Answer For Free Now!
View this answer and more for free by performing one of the following actions

Scan the QR code to install the App and get 2 free unlocks

Unlock quizzes for free by uploading documents