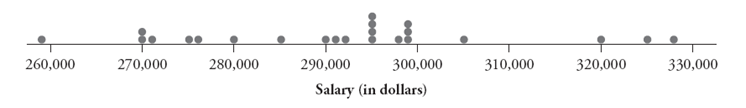
The following dotplot displays the salaries of the 23 presidents of California State University campuses for the 2007\_08 academic year:
 These salaries, arranged in order, are listed here:
a. Determine the five-number summary of these salaries. Consider the following computer output:
b. The salary for Cal Poly's President Baker is . Calculate the -score for his salary, and decide whether his salary is more than two standard deviations above the mean.
c. Check whether President Baker's salary is an outlier, according to the 1.5 _ IQR rule.
Correct Answer:
Verified
View Answer
Unlock this answer now
Get Access to more Verified Answers free of charge
Q40: The following side-by-side stemplot displays the total
Q41: The following side-by-side stemplot displays the total
Q42: The following side-by-side stemplot displays the total
Q43: An instructor conducted an in-class experiment where
Q44: In a recent study, researchers followed 104,000
Q46: The 2001_2002 National Health and Nutrition Examination
Q47: Suppose Mary records the ages of people
Q48: Construct a hypothetical example of ten exam
Q49: In a recent study, researchers purchased 40
Q50: Suppose Ben records the noon temperature in
Unlock this Answer For Free Now!
View this answer and more for free by performing one of the following actions

Scan the QR code to install the App and get 2 free unlocks

Unlock quizzes for free by uploading documents