The following table reports counts of the number of "close friends" reported by a sample of men and a sample of women: 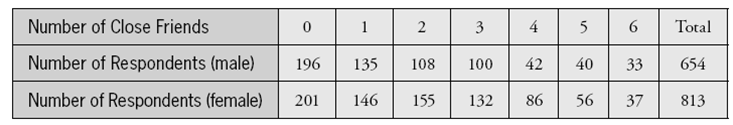
-Based on the shape of the distributions, do you expect the means to be greater than the medians, less than the medians, or very close to the medians? (Do not calculate either mean.)
Correct Answer:
Verified
View Answer
Unlock this answer now
Get Access to more Verified Answers free of charge
Q15: The following histogram displays the magnitudes of
Q16: The following histogram displays the magnitudes of
Q17: The following table reports counts of the
Q18: The following table reports counts of the
Q19: The following table reports counts of the
Q21: The following table reports counts of the
Q22: Create an example of five hypothetical
Q23: Create an example of five hypothetical exam
Q24: What effect does adding 10 points to
Q25: Is it possible for the mean value
Unlock this Answer For Free Now!
View this answer and more for free by performing one of the following actions

Scan the QR code to install the App and get 2 free unlocks

Unlock quizzes for free by uploading documents