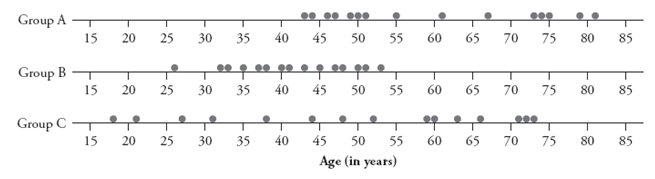
Consider the following dotplots of (hypothetical) ages for three groups of people:
 a. Which group tends to have the oldest ages? (No explanation or calculation is needed.)
b. Which group tends to have the youngest ages? (No explanation or calculation is needed.)
c. Which group has the most consistency in ages? (No explanation or calculation is needed.)
d. Which group has the least consistency in ages? (No explanation or calculation is needed.)
Correct Answer:
Verified
View Answer
Unlock this answer now
Get Access to more Verified Answers free of charge
Q47: Classify each of the following statements as
Q48: Suppose that the observational units in a
Q49: In the August 12, 2007, issue of
Q50: Another article in the October 7, 2007,
Q51: In a recent study, researchers followed 104,000
Q53: Suppose an instructor wants to investigate whether
Q54: An April 9, 2002, news release from
Q55: In a study reported in the
Q56: Suppose the observational units in a study
Q57: On June 4-24, 2007, the Gallup
Unlock this Answer For Free Now!
View this answer and more for free by performing one of the following actions

Scan the QR code to install the App and get 2 free unlocks

Unlock quizzes for free by uploading documents