Estimate the value of the quantity
-The graph below shows the rate of change of the price of a stock (in dollars per share per week) over a period of 6 weeks. Estimate the total change in dollars per share of the stock during this period. Use rectangles with widths of 1 week and let the function value at the midpoint of the rectangle give the height of the rectangle.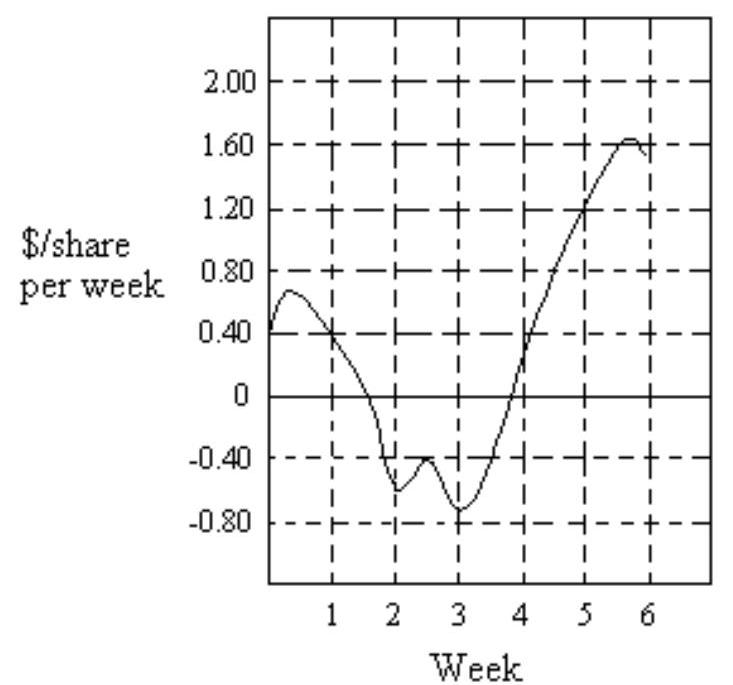
A) share
B) share
C) share
D) share
Correct Answer:
Verified
Q97: Work the exercise.
-The rate of sales
Q98: Work the exercise.
-Find the total revenue
Q99: Work the exercise.
-In a certain type
Q100: Estimate the value of the quantity
-The
Q101: Estimate the value of the quantity
-The graph
Q103: Approximate the area under the curve
Q104: Approximate the area under the curve
Q105: Approximate the area under the curve
Q106: Approximate the area under the curve
Q107: Approximate the area under the curve
Unlock this Answer For Free Now!
View this answer and more for free by performing one of the following actions

Scan the QR code to install the App and get 2 free unlocks

Unlock quizzes for free by uploading documents