Solve the Problem. -The Stem and Leaf Plot Depicts the Debt-To-Income Ratios of Debt-To-Income
Solve the problem.
-The stem and leaf plot depicts the debt-to-income ratios of loan applicants at a nearby bank.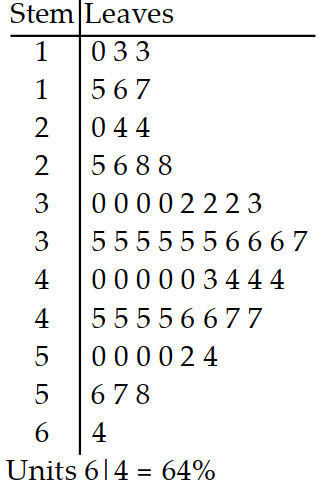
Do more applicants have debt-to-income ratios in the 20's or 50's?
A) 20 's
B) 50 's
Correct Answer:
Verified
Q23: Describe the shape of the given histogram.
-
Q24: Describe the shape of the given histogram.
-
Q25: Describe the shape of the given histogram.
-
Q26: Solve the problem.
-The stem and leaf plot
Q27: Solve the problem.
-The stem and leaf
Q29: Solve the problem.
-The stem and leaf plot
Q30: Solve the problem.
-The stem and leaf plot
Q31: Solve the problem.
-The stem and leaf plot
Q32: Solve the problem.
-The stem and leaf plot
Q33: Solve the problem.
-The stem and leaf plot
Unlock this Answer For Free Now!
View this answer and more for free by performing one of the following actions

Scan the QR code to install the App and get 2 free unlocks

Unlock quizzes for free by uploading documents