Solve the problem.
-The information in the chart below gives the salary of a person for the stated years. Model the data with a linear equation using the points and . Then use this equation to predict the salary for the year 2002 .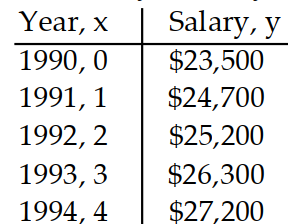
A)
B)
C)
D)
Correct Answer:
Verified
Q166: Solve the problem.
-The paired data below
Q167: Solve the problem.
-The paired data below
Q168: Solve the problem.
-The paired data below
Q169: Solve the problem.
-A study was conducted
Q170: Solve the problem.
-The information in the
Q172: Solve and graph the inequality and
Q173: Solve and graph the inequality and
Q174: Solve and graph the inequality and
Q175: Solve and graph the inequality and
Q176: Solve and graph the inequality and
Unlock this Answer For Free Now!
View this answer and more for free by performing one of the following actions

Scan the QR code to install the App and get 2 free unlocks

Unlock quizzes for free by uploading documents