The following table shows the number of computers (in millions) sold in the years 1996-2010: 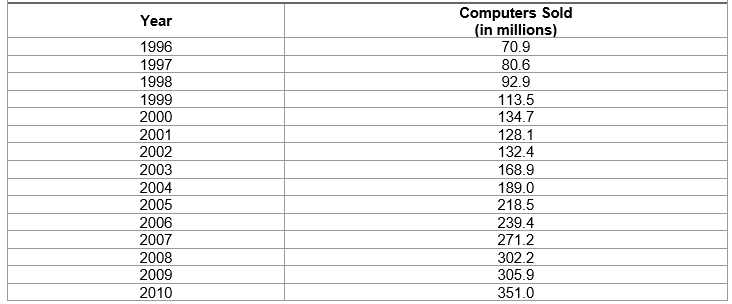 Make an x-y graph of the sales versus the year.
Correct Answer:
Verified
Q1: Define the following type of data as
Q3: Define the following type of data as
Q4: Company
Q5: Define the following type of data as
Q6: Use the information below for questions.
The
Q7: Use the information below for questions.
The
Q8: Use the information below for questions.
The
Q9: Use the information below for questions.
The
Q10: Use the information below for questions.
The
Q11: The amount of hours spent on
Unlock this Answer For Free Now!
View this answer and more for free by performing one of the following actions

Scan the QR code to install the App and get 2 free unlocks

Unlock quizzes for free by uploading documents