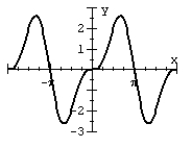
The figure below shows the graph of
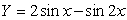
between -2π and 2π. The maximum and minimum values of the curve occur at the turning points and are found in the solutions of the equation
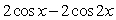
. Solve for the coordinates of the turning points of the curve between

Correct Answer:
Verified
Q66: Solve the given trigonometric equation exactly over
Q67: Solve the trigonometric equation on 0° ≤
Q68: Solve the trigonometric equation on 0° ≤
Q69: Solve the trigonometric equation on 0° ≤
Q70: If a person breathes in and out
Q72: The figure below shows the graph of
Q73: Solve the given trigonometric equation exactly
Q74: Solve the given trigonometric equation exactly
Q75: Solve the given trigonometric equation exactly
Q76: Solve the given trigonometric equation exactly
Unlock this Answer For Free Now!
View this answer and more for free by performing one of the following actions

Scan the QR code to install the App and get 2 free unlocks

Unlock quizzes for free by uploading documents