The following graph shows one of a firm's isocost curves and isoquants.
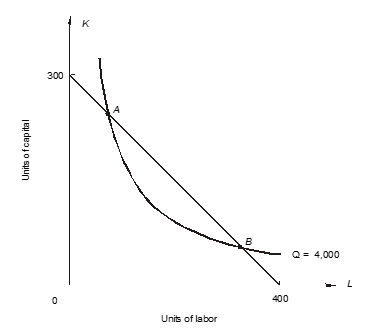
-Combination A is not an economically efficient method of producing 4,000 units of output because, at A, _________ exceeds _________ or, in other words, _________ exceeds _________. The firm should increase ___________ and decrease ___________.
Correct Answer:
Verified
View Answer
Unlock this answer now
Get Access to more Verified Answers free of charge
Q29: A firm is using 20 units of
Q30: A firm is using 20 units of
Q31: A firm is producing 1,000 units of
Q32: A firm is producing 1,000 units of
Q33: A firm is producing 1,000 units of
Q35: The following graph shows one of a
Q36: The following graph shows one of a
Q37: Answer the following questions concerning an expansion
Q38: Answer the following questions concerning an expansion
Q39: Answer the following questions concerning an expansion
Unlock this Answer For Free Now!
View this answer and more for free by performing one of the following actions

Scan the QR code to install the App and get 2 free unlocks

Unlock quizzes for free by uploading documents