Solve.
-The following graph indicates the number of vehicles sold during a seven week period by two different salespeople.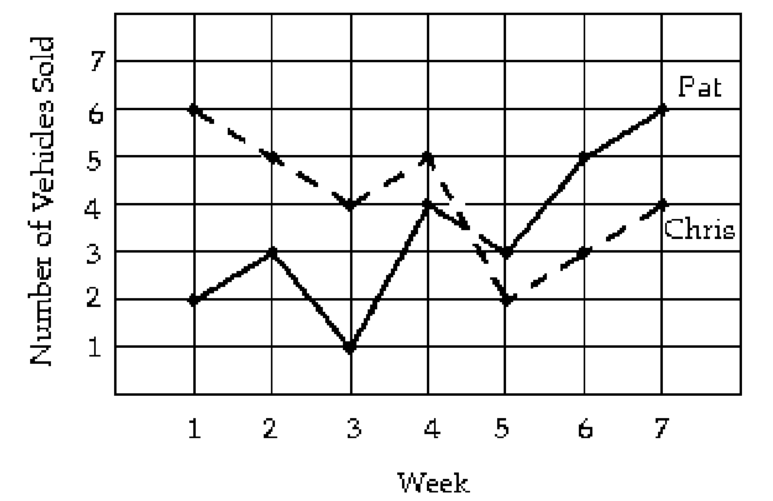
How many more vehicles did Chris sell in the first week than Pat sold in the fourth week?
A) 5 vehicles
B) 3 vehicles
C) 2 vehicles
D) 4 vehicles
Correct Answer:
Verified
Q100: Provide the appropriate response.
-In a recent city
Q101: Solve.
-Here are a student's grades at
Q102: Solve.
-The students in Hugh Logan's math class
Q103: Solve.
-The manager of a video store
Q104: Solve.
-Here are the prices (in dollars)
Q105: Solve.
-Katie and some of her friends took
Q106: Solve.
-The bar graph shows the expenditures
Q107: Solve.
-A psychologist administers four different tests and
Q109: Solve.
-The following circle graph displays Chris
Q110: Solve.
-The following graph shows the number of
Unlock this Answer For Free Now!
View this answer and more for free by performing one of the following actions

Scan the QR code to install the App and get 2 free unlocks

Unlock quizzes for free by uploading documents