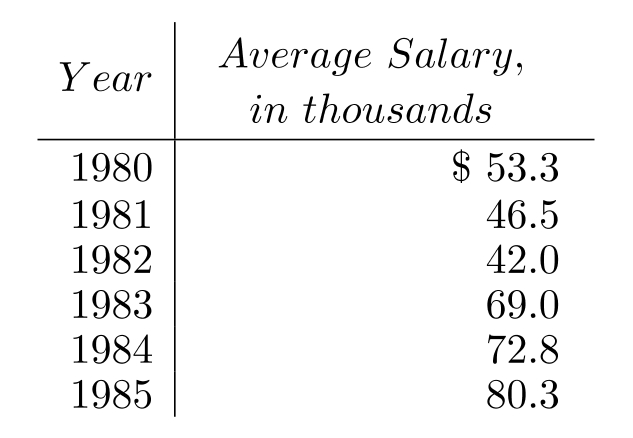
Make a line graph of the data in the table.
-The following table shows the median teacher's salary in District over several years. Use time on the horizontal scale for your line graph.
Correct Answer:
Verified
View Answer
Unlock this answer now
Get Access to more Verified Answers free of charge
Q61: Use the graph to answer the
Q62: Use the graph to answer the
Q63: Use the graph to answer the
Q64: Make a line graph of the data
Q65: Make a line graph of the data
Q67: Make a line graph of the data
Q68: Make a line graph of the data
Q69: For the set of numbers, find
Q70: For the set of numbers, find
Q71: For the set of numbers, find the
Unlock this Answer For Free Now!
View this answer and more for free by performing one of the following actions

Scan the QR code to install the App and get 2 free unlocks

Unlock quizzes for free by uploading documents