Refer to the double-bar graph below which shows the number of male and female athletes at a university over a four-year period. Solve the problem.
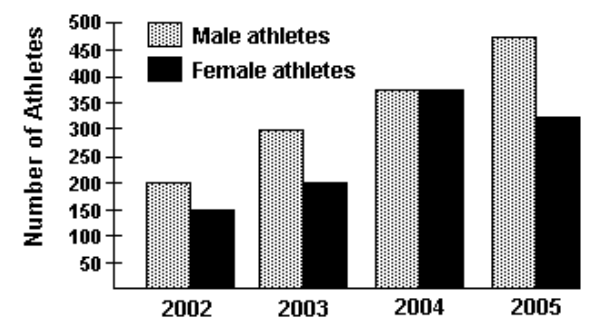
-In which year did the greatest difference between the number of male athlete and female athletes occur? Find the difference.
A) athletes
B) athletes
C) athletes
D) athletes
Correct Answer:
Verified
Q40: Refer to the double-bar graph below which
Q41: Refer to the double-bar graph below which
Q42: Refer to the double-bar graph below
Q43: Refer to the double-bar graph below
Q44: Refer to the double-bar graph below which
Q46: Refer to the double-bar graph below which
Q47: Refer to the double-bar graph below which
Q48: Refer to the double-bar graph below which
Q49: Construct a bar graph to represent the
Q50: Construct a bar graph to represent the
Unlock this Answer For Free Now!
View this answer and more for free by performing one of the following actions

Scan the QR code to install the App and get 2 free unlocks

Unlock quizzes for free by uploading documents