The graph below shows the quantity of a drug in a patient's bloodstream over a period of time , in minutes.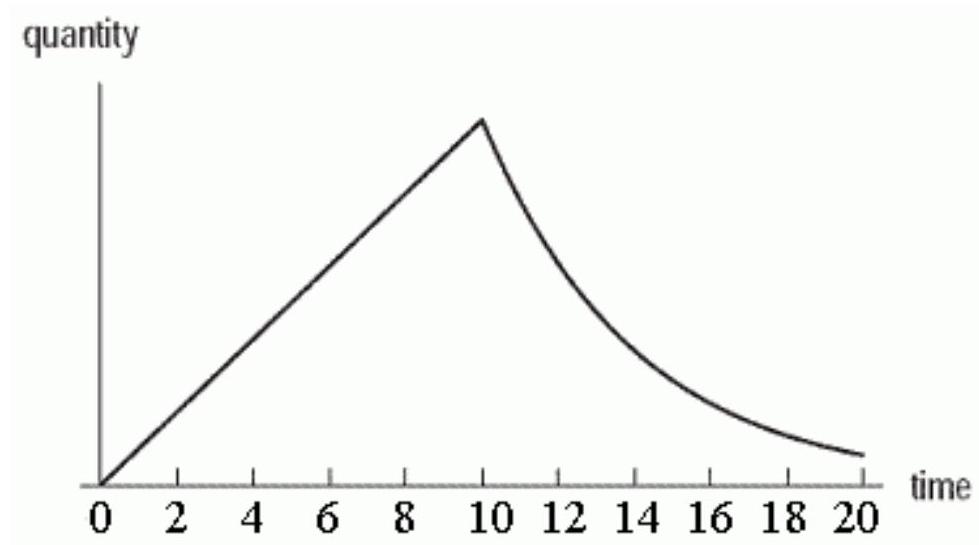
Which of the following scenarios best describes the graph?
A) The drug is injected over a 10 minute interval, during which the quantity increases linearly. After the 10 minutes, the injection is discontinued and the quantity then decays exponentially.
B) The drug is injected over a 10 minute interval, during which the quantity increases exponentially. After the 10 minutes, the injection is discontinued and the quantity then decays linearly.
C) The drug is injected all at once. The quantity first increases and then decreases linearly.
D) The drug is injected all at once. The quantity first increases and then decreases exponentially.
Correct Answer:
Verified
Q24: The average life expectancy in a country
Q25: The following table gives values from
Q26: The table below shows
Q27: A population has size 3,500 at
Q28: A population has size 3,000 at
Q30: Kevin buys a new CD player
Q31: A biologist measures the amount of
Q32: A biologist measures the amount of
Q33: A biologist measures the amount of
Q34: Let
Unlock this Answer For Free Now!
View this answer and more for free by performing one of the following actions

Scan the QR code to install the App and get 2 free unlocks

Unlock quizzes for free by uploading documents