Short Answer
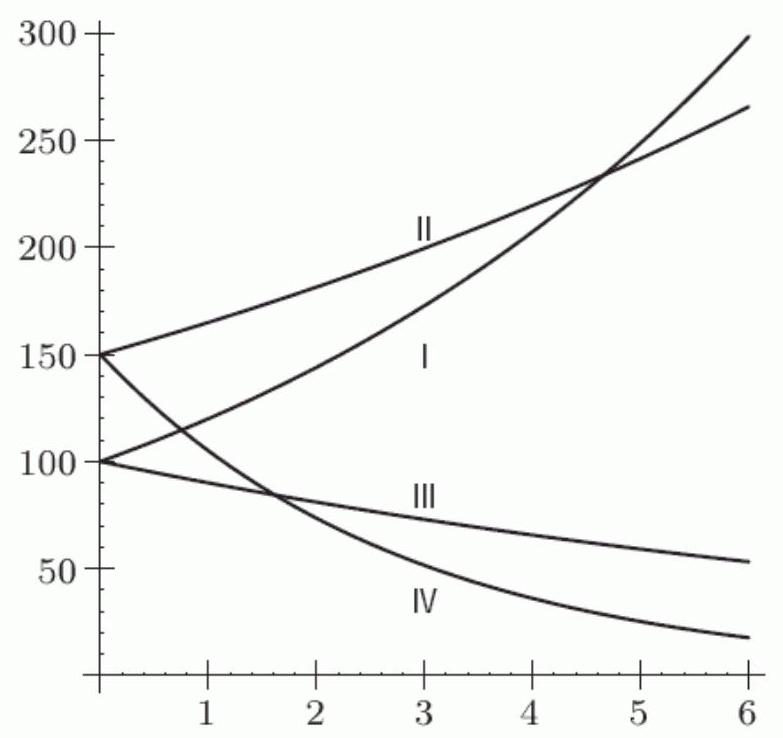
Which of the graphs in the following figure is the graph of ?
Correct Answer:
Verified
Related Questions
Q1: In the exponential formula
Q2: In 2006, the cost of a
Q3: If you start with
Q4: If you start with
Q6: What is the growth factor if
Q7: The populations of 4 species of
Q8: The populations of 4 species of
Q9: The populations of 4 species of
Q10: The US population in 2005 was
Q11: A quantity decreased from 100 to 95
Unlock this Answer For Free Now!
View this answer and more for free by performing one of the following actions

Scan the QR code to install the App and get 2 free unlocks

Unlock quizzes for free by uploading documents