Short Answer
The data points for the following table are graphed in the figures below.
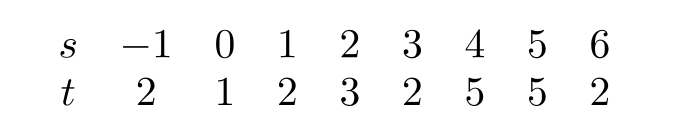
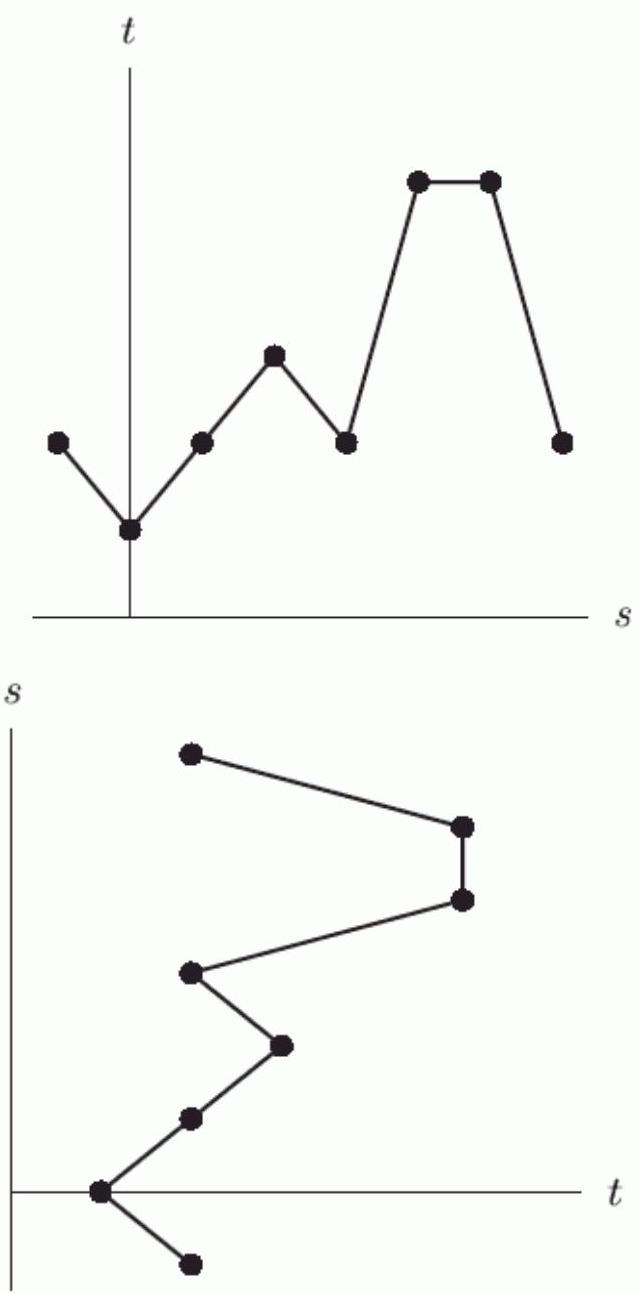
For the graph that is a function, we could write -----------=f(----------------), where is ------------ the dependent variable and ----------------- is the independent variable. (Fill in each blank with an or a " ").
Correct Answer:
Verified
Part A: 
P...
P...
View Answer
Unlock this answer now
Get Access to more Verified Answers free of charge
Related Questions
Unlock this Answer For Free Now!
View this answer and more for free by performing one of the following actions

Scan the QR code to install the App and get 2 free unlocks

Unlock quizzes for free by uploading documents