Use the following to answer the questions below:
November 6, 2012 was election day. Many of the major television networks aired coverage of the incoming election results during the primetime hours. The provided table displays the amount of time (in minutes) spent watching election coverage for a random sample of 25 U.S. adults.
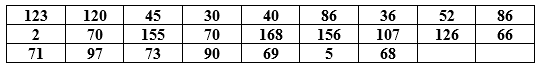
-Percentiles of the bootstrap distribution (based on 5,000 samples) are provided. Use the percentiles to provide a 92% confidence interval for the mean amount of time (in minutes) U.S. adults spent watching election coverage on election night. Indicate which percentiles you are using. 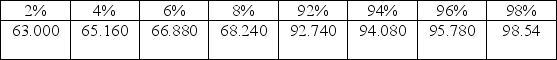
A) 65.160 to 95.780 minutes (use the 4%- and 96%-iles)
B) 63.000 to 98.540 minutes (use the 2%- and 98%-iles)
C) 66.880 to 94.080 minutes (use the 6%- and 94%-iles)
D) 68.240 to 92.740 minutes (use the 8%- and 92%-iles)
Correct Answer:
Verified
Q110: Use the following to answer the
Q111: Use the following to answer the questions
Q112: Use the following to answer the questions
Q113: Use the following to answer the questions
Q114: Use the following to answer the questions
Q116: Use the following to answer the questions
Q117: Use the following to answer the following
Q118: Use the following to answer the following
Q119: Use the following to answer the following
Q120: Use the following to answer the following
Unlock this Answer For Free Now!
View this answer and more for free by performing one of the following actions

Scan the QR code to install the App and get 2 free unlocks

Unlock quizzes for free by uploading documents