Use the following to answer the questions below:
November 6, 2012 was election day. Many of the major television networks aired coverage of the incoming election results during the primetime hours. The provided table displays the amount of time (in minutes) spent watching election coverage for a random sample of 25 U.S. adults.
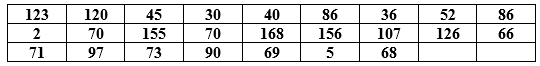
-Interpret your 92% confidence interval in the context of this data situation.
Correct Answer:
Verified
View Answer
Unlock this answer now
Get Access to more Verified Answers free of charge
Q103: Use the following to answer the
Q104: Use the following to answer the questions
Q105: Use the following to answer the questions
Q106: Use the following to answer the questions
Q107: Use the following to answer the questions
Q109: Use the following to answer the questions
Q110: Use the following to answer the
Q111: Use the following to answer the questions
Q112: Use the following to answer the questions
Q113: Use the following to answer the questions
Unlock this Answer For Free Now!
View this answer and more for free by performing one of the following actions

Scan the QR code to install the App and get 2 free unlocks

Unlock quizzes for free by uploading documents