Use the following to answer the questions below:
According to ESPN.com, the average number of yards per game for all NFL running backs with at least 50 attempts in the 2011 season was 49 yards/game. A sample of 20 running backs from the 2011 season averaged 46.54 yards/game.
-Two boxplots are shown. One boxplot corresponds to the yards/game for a random sample of 
running backs. The other boxplot represents the values in a sampling distribution of 1,000 means of yards/game for samples of size n = 20.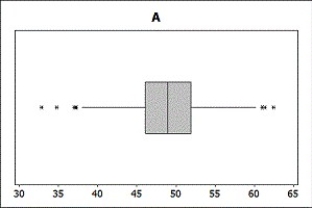
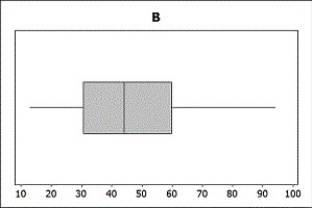
Which boxplot represents the sample? Which boxplot represents the sampling distribution?
A) Boxplot A is the sampling distribution while Boxplot B is a single sample.
B) Boxplot B is the sampling distribution while Boxplot A is a single sample.
Correct Answer:
Verified
Q26: Use the following to answer the questions
Q27: Use the following to answer the questions
Q28: Use the following to answer the questions
Q29: Use the following to answer the questions
Q30: Use the following to answer the questions
Q32: Use the following to answer the questions
Q33: Use the following to answer the questions
Q34: Use the following to answer the questions
Q35: Use the following to answer the questions
Q36: Use the following to answer the questions
Unlock this Answer For Free Now!
View this answer and more for free by performing one of the following actions

Scan the QR code to install the App and get 2 free unlocks

Unlock quizzes for free by uploading documents