The table lists the Gross Domestic Product (GDP) from 2004 to 2008 in billions of dollars. (Source: U.S. Department of Commerce)
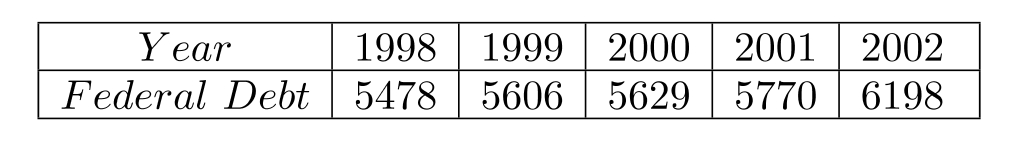
(a) Find the least-squares regression line for the data. Give the correlation coefficient.
(b) Use this line to predict the federal debt in 2009.
Correct Answer:
Verified
Q5: Consider the linear function
Q6: During the period from 1996 to 2006
Q7: Find the equation of the line
Q8: Find the
Q9: Give the equations of both the
Q11: Suppose that an empty circular wading
Q12: For each of the functions, determine the
Q13: Use the figure to solve each
Q14: Use the screen to solve the
Q15: Consider the linear functions
Unlock this Answer For Free Now!
View this answer and more for free by performing one of the following actions

Scan the QR code to install the App and get 2 free unlocks

Unlock quizzes for free by uploading documents