Multiple Choice
figure shows the graph of versus time for an object moving along the -axis. Solve graphically for the distance traveled from to .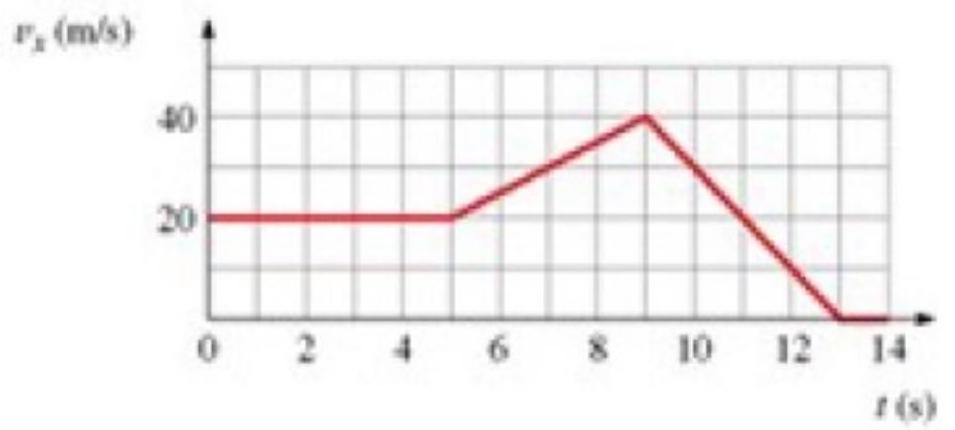
A)
B)
C)
D)
Correct Answer:
Verified
Related Questions
Unlock this Answer For Free Now!
View this answer and more for free by performing one of the following actions

Scan the QR code to install the App and get 2 free unlocks

Unlock quizzes for free by uploading documents