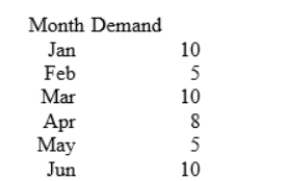
The table below shows the demand for Gadgets (they're like Widgets, only they're more mechanical) over a five-month period. Calculate exponential smoothing forecasts for each month and for July. Use a coefficient of 0.5 and assume that the forecast for January was 8. Also evaluate the quality of the exponential smoothing model by calculating the root-mean-square error for the data set. Note: round all intermediate calculations to two decimal places.
Correct Answer:
Verified
View Answer
Unlock this answer now
Get Access to more Verified Answers free of charge
Q8: The use of leading indicators to forecast
Q9: The use of an estimated demand equation
Q10: Forecasts based on leading indicators are qualitative.
Q11: Macroeconomic forecasts are generally based on multiple-equation
Q12: Definitional equations must be estimated using regression
Q13: The table below shows semi-annual demand (in
Q14: The table below shows semi-annual demand (in
Q15: The table below shows the demand for
Q17: A firm has determined that its average
Q18: A firm has determined that its average
Unlock this Answer For Free Now!
View this answer and more for free by performing one of the following actions

Scan the QR code to install the App and get 2 free unlocks

Unlock quizzes for free by uploading documents