Viewing the results in the following scatterplot, for the 11 cases to the left subset (Age < 40) , two belong to Class 1 and nine belong to Class 0. In the right subset (Age ? 40) three belong to Class 1 and one belong to Class 0. What is the Index score for the two subsets? 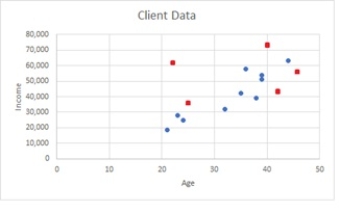
A) (Age < 40) = 0.3636; (Age 40) = 0.50
B) (Age < 40) = 0.20; (Age 40) = 0.25
C) (Age < 40) = 0.298; (Age 40) = 0.375
D) (Age < 40) = 0.375; (Age 40) = 0.298
Correct Answer:
Verified
Q6: Based on the following values for income,
Q7: If 73% of the cases belong to
Q8: If 80% of the cases belong to
Q9: In reviewing the split of data, Maggie
Q10: In reviewing the split of data, Maggie
Q12: Robin wanted to know if the
Q13: Robin wanted to know if the
Q14: A split at the $32,000 Income point
Q15: Which description best fits the following tree
Q16: In R, to determine the number of
Unlock this Answer For Free Now!
View this answer and more for free by performing one of the following actions

Scan the QR code to install the App and get 2 free unlocks

Unlock quizzes for free by uploading documents