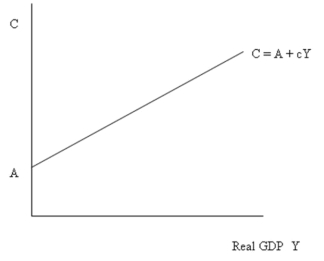
-In Figure 6.1:
A) the point A represents autonomous consumption.
B) c represents the slope of the line.
C) c represents the marginal propensity to consume.
D) all of the above
Correct Answer:
Verified
Q9: Which one of the following expressions best
Q10: Empirical data show that a strong, positive
Q11: Which of the following statements about the
Q12: The marginal propensity to consume (MPC):
A) shows
Q13: In the absence of a government sector,
Q15: The relationship between household saving and the
Q16: Which one of the following statements about
Q17: Other things constant, the slope of the
Q18: The arithmetic value of 1 - MPC
Q19: Other things constant, an increase in households'
Unlock this Answer For Free Now!
View this answer and more for free by performing one of the following actions

Scan the QR code to install the App and get 2 free unlocks

Unlock quizzes for free by uploading documents