The graph below shows the number of birds at a bird feeder as a function of time.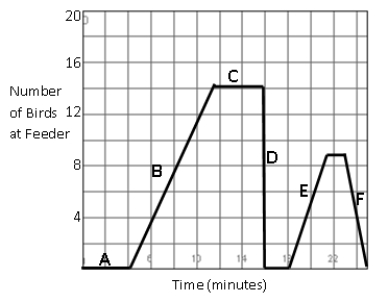
What event most likely occurred during interval E?
A) A cat chases all the birds away.
B) Birds are coming back after being chased away by a cat.
C) The feeder is full of birds and there is no room for more.
D) The feeder was still empty from the previous day.
Correct Answer:
Verified
Q132: On what interval is this graph decreasing.
Q133: State the interval on which this graph
Q134: State the interval on which this graph
Q135: Identify the maximum of this function over
Q136: Identify the minimum of this function over
Q138: Determine the domain of this graph. Express
Q139: Determine the range of this graph. Express
Q140: Use the graph of y = f(x)
Q141: Given the graph of velocity as a
Q142: Use technology to graph the function and
Unlock this Answer For Free Now!
View this answer and more for free by performing one of the following actions

Scan the QR code to install the App and get 2 free unlocks

Unlock quizzes for free by uploading documents