The frequency table below describes the age distribution of students in a college algebra class. Based on this information, estimate the largest possible value for the mean age of this class.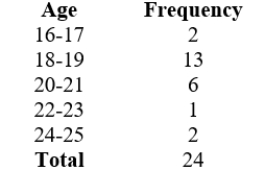
Which of the following is the largest possible mean?
Round your answers to 2 decimals if necessary.
A) 19.00
B) 20.00
C) 19.5
D) 18.5
Correct Answer:
Verified
Q14: On a recent test in a College
Q15: In a group of seven people the
Q16: In a group of seven people the
Q17: The frequency table below describes the age
Q18: The frequency table below describes the age
Q20: The 1999 graduates of Bottom Line University
Q21: The 2006 graduates of Bottom Line University
Q22: For the following data:
61, 59, 77, 71,
Q23: For the following data:
51, 47, 63, 59,
Q24: For the following data:
76, 74, 92, 86,
Unlock this Answer For Free Now!
View this answer and more for free by performing one of the following actions

Scan the QR code to install the App and get 2 free unlocks

Unlock quizzes for free by uploading documents