Tell whether the graph has a positive or negative relationship.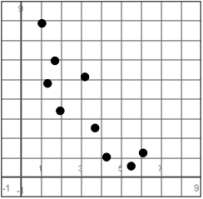
A) Positive
B) Negative
Correct Answer:
Verified
Q205: Find the equation to describe the data
Q206: State whether the data shown in the
Q207: The following table gives the average daily
Q208: A student who works as a waiter
Q209: Use regression to find a linear function
Q210: The data below gives the mean annual
Q212: The following equation represents the best-fit regression
Q213: The following equation represents the best-fit regression
Q214: The following equation represents the best-fit regression
Q215: The following equation represents the best-fit regression
Unlock this Answer For Free Now!
View this answer and more for free by performing one of the following actions

Scan the QR code to install the App and get 2 free unlocks

Unlock quizzes for free by uploading documents