This table shows the final exam scores (y) compared to the hours studied (x) for 5 randomly selected students.
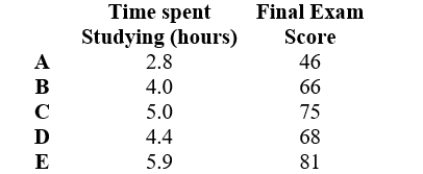
A) . Use points A and D from this table to estimate the slope of the linear model for this data.Round the answer to 2 decimal places.
B) . Use point A to determine the vertical intercept of the linear model.Round the answer to 2 decimal places.
Correct Answer:
Verified
Q195: Graph the function Q196: Create the step function from the graph: Q197: Which graph represents your distance from home Q198: For the following table, reinitialize the independent Q199: Use points D and E from this Q201: Create an estimate of a linear model Q202: Create an estimate of a linear model Q203: Use an estimate of a linear model Q204: Choose the equation that matches the graph. Q205: Find the equation to describe the data![]()
Unlock this Answer For Free Now!
View this answer and more for free by performing one of the following actions

Scan the QR code to install the App and get 2 free unlocks

Unlock quizzes for free by uploading documents