Use the following to answer questions
The following graph shows the percent of families in the U.S. living below the poverty level by year.
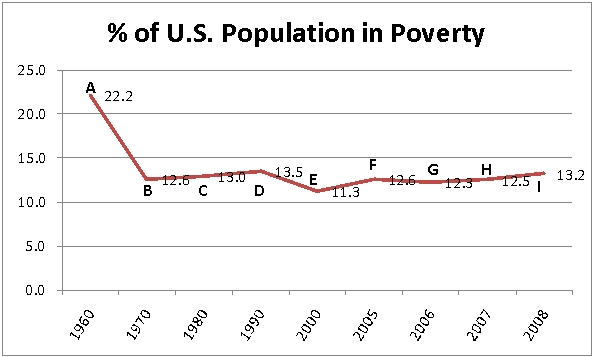
-What is the rate of change in families living in poverty from B to I? (Round the answer to 3 decimal places.)
Correct Answer:
Verified
Q70: Which line has the steeper slope?
A) ?
Q71: Which of these two graphs makes the
Q72: Use the following to answer questions
The
Q73: Use the following to answer questions
The
Q74: Use the following to answer questions
The
Q76: The following graphs shows the number of
Q77: The following graph shows the percentage of
Q78: Determine whether the following data is linear.
Q79: Identify A) the slope and B) the
Q80: Identify A) the slope and B) the
Unlock this Answer For Free Now!
View this answer and more for free by performing one of the following actions

Scan the QR code to install the App and get 2 free unlocks

Unlock quizzes for free by uploading documents