The following table shows the size of the graduating senior class at BLE high school for several years.
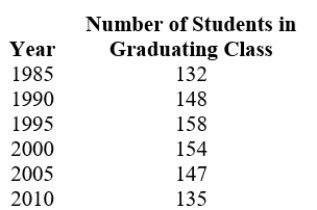
Which 5 year period has the largest positive rate of change in the size of the graduating class?
Correct Answer:
Verified
Q24: If the function is decreasing, then the
Q25: Complete the sentence to describe the graph
Q26: Complete the sentence to describe the graph
Q27: Choose the graph that is described by
Q28: The following table shows the size of
Q30: The following table shows the size of
Q31: The following table shows the size of
Q32: The following table gives information about the
Q33: The following table gives information about the
Q34: The average costs, by year, of a
Unlock this Answer For Free Now!
View this answer and more for free by performing one of the following actions

Scan the QR code to install the App and get 2 free unlocks

Unlock quizzes for free by uploading documents