The following table shows the enrollment in a private college for the years 1996 to 2005. Interpret these figures as partial sums,  , of terms of a sequence,
  , where n is the number of years since 1995 (so
 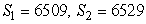 , etc.) .
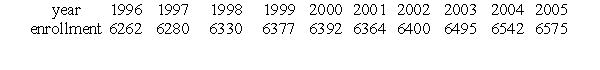 Which of the following gives the total enrollment in 2004?
A) 
B) 
C) 
D) 
Correct Answer:
Verified
Q39: The population of Arizona rose from 5,130,635
Q40: Does Q41: Does Q42: What is the sum of the first Q43: The following table shows the enrollment in Q45: The following table shows the enrollment in Q46: The following table shows the enrollment in Q47: A person decides to walk for 15 Q48: Does Q49: If Unlock this Answer For Free Now! View this answer and more for free by performing one of the following actions Scan the QR code to install the App and get 2 free unlocks Unlock quizzes for free by uploading documents![]()
![]()
![]()
![]()

