Annual measurements of the number of powerboat registrations (in thousands) and the number of manatees killed by powerboats in Florida were collected over the 14 years 1977-1990. A scatterplot of the data, least squares regression line, and correlation coefficient follow. 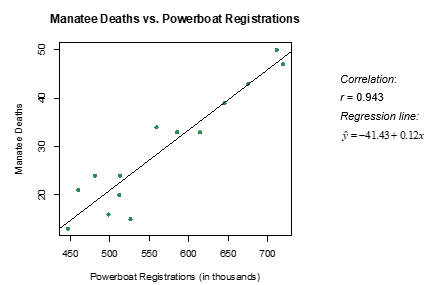
-Which of the following is a correct interpretation of the coefficient of determination?
A) About 94.3% of the variation in manatee deaths can be explained by the number of powerboat registrations.
B) About 88.9% of the variation in manatee deaths can be explained by the number of powerboat registrations.
C) An increase of 1,000 powerboat registrations is associated with a predicted increase of 0.943 manatee deaths.
D) An increase of 1,000 powerboat registrations is associated with a predicted increase of 0.889 manatee deaths.
Correct Answer:
Verified
Q33: Annual measurements of the number of powerboat
Q34: Annual measurements of the number of powerboat
Q35: Annual measurements of the number of powerboat
Q36: Annual measurements of the number of powerboat
Q37: Annual measurements of the number of powerboat
Q39: Data from the World Bank for 25
Q40: Data from the World Bank for 25
Q41: Data from the World Bank for 25
Q42: Observations with values of the explanatory variable
Q43: The least squares regression line minimizes the
Unlock this Answer For Free Now!
View this answer and more for free by performing one of the following actions

Scan the QR code to install the App and get 2 free unlocks

Unlock quizzes for free by uploading documents