The following scatterplot displays the finish time (in minutes) and age (in years) for the male racers at the 2018 Strawberry Stampede (a 10k race through Arroyo Grande) . 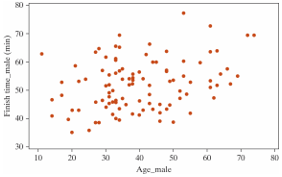
-What is the form of this scatterplot?
A) Linear
B) Non-linear
Correct Answer:
Verified
Q2: Babies born with low birth weights (less
Q3: Babies born with low birth weights (less
Q4: Babies born with low birth weights (less
Q5: Babies born with low birth weights (less
Q6: Babies born with low birth weights (less
Q8: The following scatterplot displays the finish time
Q9: The following scatterplot displays the finish time
Q10: The following scatterplot displays the finish time
Q11: Which of the following plots has the
Q12: Estimate the value of the correlation coefficient
Unlock this Answer For Free Now!
View this answer and more for free by performing one of the following actions

Scan the QR code to install the App and get 2 free unlocks

Unlock quizzes for free by uploading documents