A relative frequency histogram for the sale prices of homes sold in one city during 2010 is shown below. Based on the histogram, is a large sample necessary to conduct a hypothesis test about the mean sale price? If so, why? 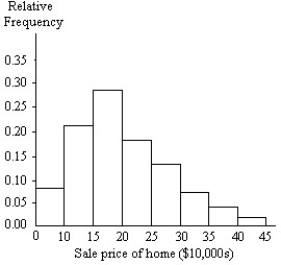
A) Yes; data do not appear to be normally distributed but bimodal.
B) No; data appear to be normally distributed.
C) Yes; data do not appear to be normally distributed but skewed left.
D) Yes; data do not appear to be normally distributed but skewed right.
Correct Answer:
Verified
Q12: A method currently used by doctors to
Q13: A method currently used by doctors to
Q14: Determine the critical value, Q15: Determine the test statistic, z, to test Q16: Test the claim about the population proportion Q18: The ages of a group of patients Q19: The weekly salaries (in dollars) of randomly Q20: The weights (in ounces) of a sample Q21: Find the test statistic Q22: Find the test statistic Unlock this Answer For Free Now! View this answer and more for free by performing one of the following actions Scan the QR code to install the App and get 2 free unlocks Unlock quizzes for free by uploading documents![]()
![]()
![]()

