Determine whether the graph can represent a normal curve. If it cannot, explain why.
-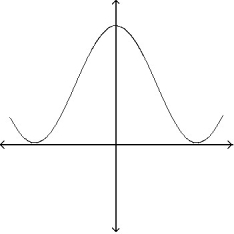
A) The graph cannot represent a normal density function because it increases as x becomes very large or very small.
B) The graph can represent a normal density function.
C) The graph cannot represent a normal density function because it takes negative values for some values of x.
D) The graph cannot represent a normal density function because the area under the graph is greater than 1.
Correct Answer:
Verified
Q2: Compare a graph of the normal density
Q3: Compare a graph of the normal density
Q4: Draw a normal curve with ? =
Q5: You are performing a study about the
Q6: The graph of a normal curve is
Q8: Determine whether the graph can represent a
Q9: Determine whether the graph can represent a
Q10: Determine whether the graph can represent a
Q11: The analytic scores on a standardized aptitude
Q12: Find the sum of the areas under
Unlock this Answer For Free Now!
View this answer and more for free by performing one of the following actions

Scan the QR code to install the App and get 2 free unlocks

Unlock quizzes for free by uploading documents