Multiple Choice
The graph shown in the figure below is the graph of which function?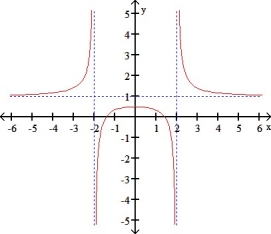
A) y = 
B) y = 
C) y = 
D) y = 
E) y = 
Correct Answer:
Verified
Related Questions
Q85: Find the local extrema and inflection points
Q86: Let f(x) = Q87: The graph of f(x) = 3 Q88: Use information from the function and its Q89: Use information from the function and its Q91: Find two positive numbers whose sum is Q92: Find two nonnegative numbers whose sum is Q93: A rectangular enclosure subdivided into four pens Q94: An open rectangular box with square base Q95: A poster has an area of 800![]()
Unlock this Answer For Free Now!
View this answer and more for free by performing one of the following actions

Scan the QR code to install the App and get 2 free unlocks

Unlock quizzes for free by uploading documents