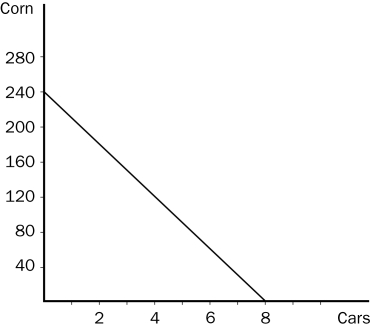
Figure 3-5 The graph below represents the various combinations of cars and corn that Country A could produce in a given month. (On the vertical axis, corn is measured in bushels.)

-Refer to Figure 3-5.Suppose Country B is willing to trade 40 bushels of corn to Country A for each car that Country A produces and sends to Country B.Which of the following combinations of cars and corn could Country A then consume,assuming Country A specializes in car production?
A) 2 cars and 240 bushels of corn
B) 3 cars and 220 bushels of corn
C) 4 cars and 200 bushels of corn
D) 5 cars and 140 bushels of corn
Correct Answer:
Verified
Q56: Suppose that a worker in Freedonia can
Q152: Table 3-5 Q153: Figure 3-5 The graph below represents the Q154: Table 3-5 Q155: Table 3-5 Q156: Figure 3-5 The graph below represents the Q158: Figure 3-5 The graph below represents the Unlock this Answer For Free Now! View this answer and more for free by performing one of the following actions Scan the QR code to install the App and get 2 free unlocks Unlock quizzes for free by uploading documents
![]()
![]()
![]()

