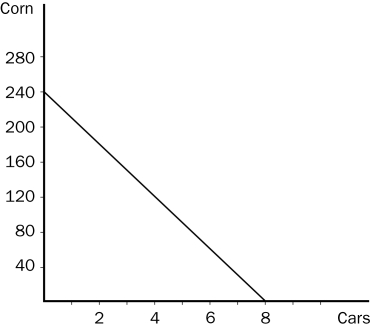
Figure 3-5 The graph below represents the various combinations of cars and corn that Country A could produce in a given month. (On the vertical axis, corn is measured in bushels.)

-Refer to Figure 3-5.The graph that is shown is called a
A) supply line.
B) opportunity line.
C) production possibilities frontier.
D) consumption possibilities frontier.
Correct Answer:
Verified
Q144: Table 3-5 Q145: Table 3-5 Q146: A good that is produced abroad and Q147: Table 3-5 Q148: Figure 3-5 The graph below represents the Q150: Table 3-5 Q151: Figure 3-5 The graph below represents the Q152: Table 3-5 Q153: Figure 3-5 The graph below represents the Q154: Table 3-5 Unlock this Answer For Free Now! View this answer and more for free by performing one of the following actions Scan the QR code to install the App and get 2 free unlocks Unlock quizzes for free by uploading documents
![]()
![]()
![]()
![]()
![]()
![]()

