Data Set 13-10: The bar graphs show the results of Experiment X and Experiment Y. Each bar is based on a sample of 8.
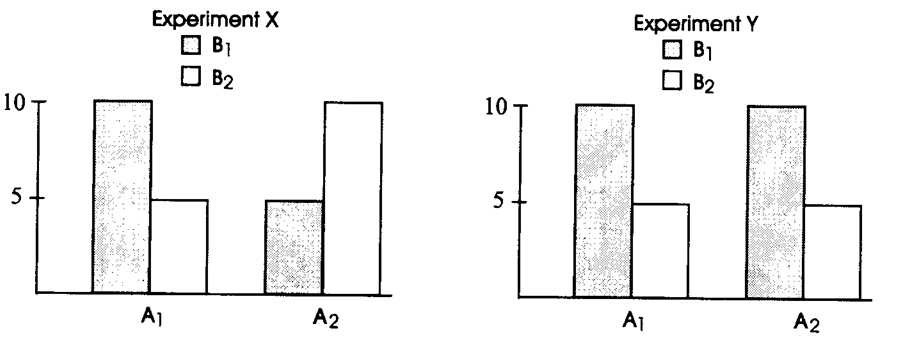
-The degrees of freedom for the interaction in Experiment Y in Data Set 13-10 are
A) 4, 40
B) 2, 37
C) 1, 36
D) 1 , 28
Correct Answer:
Verified
Q64: Data Set 13-9: Each point represents a
Q65: Data Set 13-9: Each point represents a
Q66: Data Set 13-10: The bar graphs show
Q67: Data Set 13-10: The bar graphs show
Q68: Data Set 13-10: The bar graphs show
Q70: Among behavioral scientists, factorial ANOVA designs were
Q71: With respect to the number of independent
Q72: With respect to the number of independent
Q73: With respect to the number of independent
Q74: If you add the number of independent
Unlock this Answer For Free Now!
View this answer and more for free by performing one of the following actions

Scan the QR code to install the App and get 2 free unlocks

Unlock quizzes for free by uploading documents