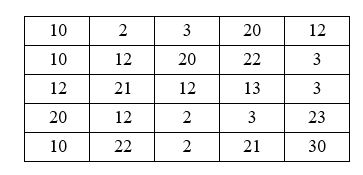
The following diagram shows a raster with its origin (0, 0) at the upper left corner. Suppose that the raster is used for a couple of 3-by-3 neighborhood operations. (1) What is the range statistic for (col. 3, row3)? (2) What is the majority statistic for (col. 3, row3)? (3) What is the variety statistic for (col. 3, row3)?
Correct Answer:
Verified
Q10: Illustrate with a diagram a 3-by-3 neighborhood
Q11: Which local operation can assign a unique
Q12: What types of neighborhoods can be used
Q13: A zone in raster data operation may
Q14: To define a riparian zone, a government
Q16: The cell value of 'no data' is
Q17: Which of the following mathematical functions can
Q18: Which of the following can be used
Q19: A local operation is limited to only
Q20: Define "map algebra" for raster data analysis.
Unlock this Answer For Free Now!
View this answer and more for free by performing one of the following actions

Scan the QR code to install the App and get 2 free unlocks

Unlock quizzes for free by uploading documents