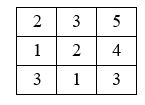
The diagram below represents a cost raster, with the origin at the upper left corner. (1) What is the cost for moving from (col. 1, row. 1) to (col. 2, row 1)? (2) What is the cost for moving from (col. 1, row. 1) to (col. 2, row 2)? (3) What is the least accumulative cost from (col. 1, row. 1) to (col. 2, row 3)?
Correct Answer:
Verified
Q1: Link impedance for network applications can be
Q2: What is the main objective of the
Q3: Explain the difference between a network and
Q4: A shortest-path analysis can include intermediate stops
Q5: A _ link connects a cell to
Q7: Least-cost path analysis is _based, and network
Q8: Explain the role of a source raster
Q9: How does the surface distance differ from
Q10: Explain the difference between the minimum impedance
Q11: The surface distance measure is calculated from
Unlock this Answer For Free Now!
View this answer and more for free by performing one of the following actions

Scan the QR code to install the App and get 2 free unlocks

Unlock quizzes for free by uploading documents