Figure 1.1 U.S. Production Possibilities Curve
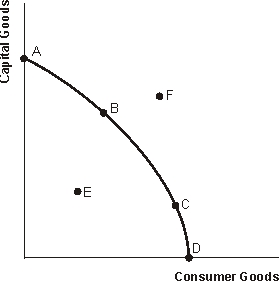
-Refer to Figure 1.1. Which of the following could allow the economy to move from point B to point F over time?
A) a reduction in the unemployment rate
B) a decrease in the productivity of labor
C) an increase in sodas consumed
D) an advance in technology
Correct Answer:
Verified
Q57: Assuming that rational people are motivated by
Q58: Figure 1.1 U.S. Production Possibilities Curve
Q59: Figure 1.1 U.S. Production Possibilities Curve
Q60: Figure 1.1 U.S. Production Possibilities Curve
Q61: Figure 1.1 U.S. Production Possibilities Curve
Q63: Table 1.1. U.S. Production Possibilities Curve
Q64: Table 1.1. U.S. Production Possibilities Curve
Q65: Table 1.1. U.S. Production Possibilities Curve
Q66: Table 1.1. U.S. Production Possibilities Curve
Q67: Table 1.1. U.S. Production Possibilities Curve
Unlock this Answer For Free Now!
View this answer and more for free by performing one of the following actions

Scan the QR code to install the App and get 2 free unlocks

Unlock quizzes for free by uploading documents