(Figure: Demand Curve 2) Use the graph of a demand curve for monthly music streaming subscriptions to answer the following question. The vertical axis is the monthly price of a subscription and the horizontal axis is millions of monthly subscriptions for the market. What is the total consumer surplus if three million subscriptions are sold at a price of $4 each?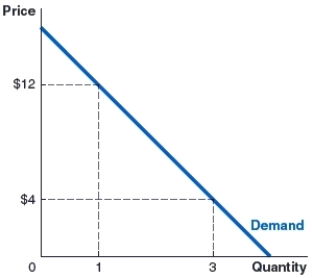
A) $8,000,000
B) $12,000,000
C) $15,000,000
D) $24,000,000
Correct Answer:
Verified
Q39: Chin purchases five protein bars at a
Q40: The highest price that Dara would be
Q41: The highest price that Duke would be
Q42: In a market graph, consumer surplus is
Q43: (Figure: Demand Curve) Use the graph of
Q45: (Figure: Demand Curve 3) Use the graph
Q46: Carlos buys six new plants for his
Q47: Pule is purchasing four bottles of bathroom
Q48: When Chandra is hiking on a hot
Q49: The producer surplus on a unit sold
Unlock this Answer For Free Now!
View this answer and more for free by performing one of the following actions

Scan the QR code to install the App and get 2 free unlocks

Unlock quizzes for free by uploading documents