Reference - 10.3: Use the graph given below to answer questions
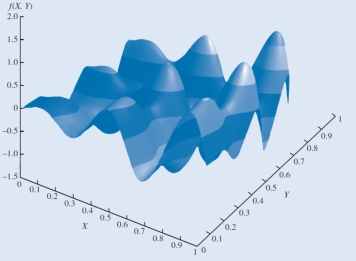
-Reference - 10.3. The feasible region for the function represented in the graph is:
A) -1 ≤ X ≤ 1, -1 ≤ Y ≤ 1.
B) -1.5 ≤ X ≤ 1, 0 ≤ Y ≤ ∞.
C) -1.5 ≤ X ≤ 2.0, -1.5 ≤ Y ≤ 2.0.
D) 0 ≤ X ≤ 1, 0 ≤ Y ≤ 1.
Correct Answer:
Verified
Q31: The _ forecasting model uses nonlinear optimization
Q32: The portfolio variance is the
A)sum of the
Q33: If the portfolio variance were equal to
Q34: Which of the following conclusions can be
Q34: A portfolio optimization model used to construct
Q36: Solving nonlinear problems with local optimal solutions
Q37: Reference - 10.2: Use the graph given
Q38: In the Bass forecasting model, parameter m
A)measures
Q39: Excel Solver's _ is based on a
Q41: Roger is willing to promote and sell
Unlock this Answer For Free Now!
View this answer and more for free by performing one of the following actions

Scan the QR code to install the App and get 2 free unlocks

Unlock quizzes for free by uploading documents