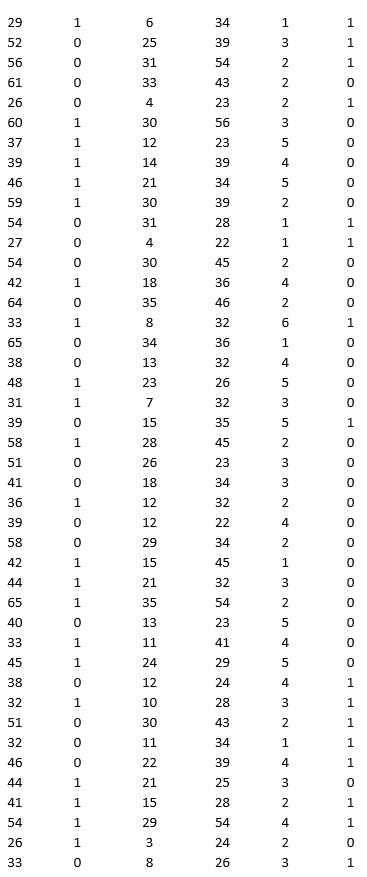
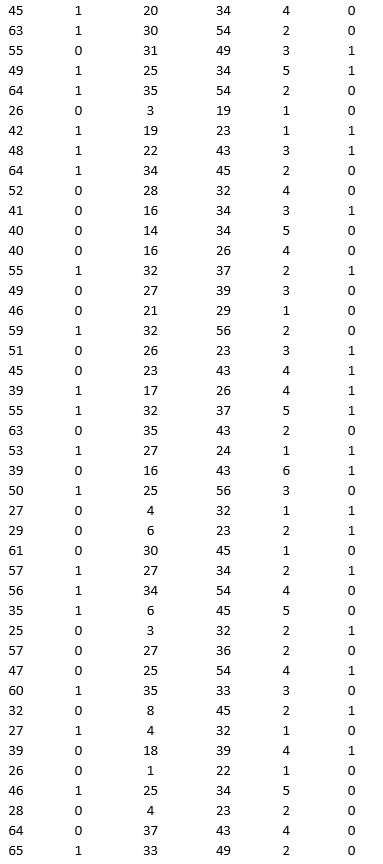
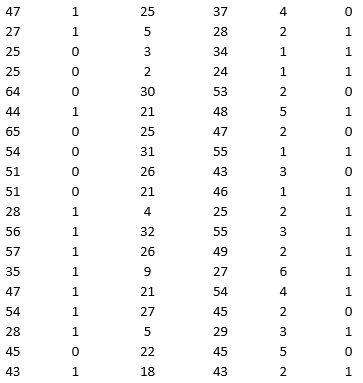
A bank is interested in identifying different attributes of its customers and below is the sample data of 150 customers. In the data table for the dummy variable Gender, 0 represents Male and 1 represents Female. And for the dummy variable Personal loan, 0 represents a customer who has not taken personal loan and 1 represents a customer who has taken personal loan.

Partition the data into training (50 percent), validation (30 percent), and test (20 percent) sets. Fit a classification tree using Age, Gender, Work experience, Income (in 1000 $), and Family size as input variables and Personal loan as the output variable. In Step 2 of XLMiner's Classification Tree procedure, be sure to Normalize input data and to set the Minimum #records in a terminal node to 1. In Step 3 of XLMiner's Classification Tree procedure, set the maximum number of levels to seven. Generate the Full tree, Best pruned tree, and Minimum error tree. Generate lift charts for both the validation data and the test data.
a. Interpret the set of rules implied by the best pruned tree that characterize the customers who have taken personal loan.
b. For the default cutoff value of 0.5, what is the overall error rate, Class 1 error rate, and Class 0 error rate of the best pruned tree on the test data? Interpret these respective measures.
c. Examine the decile-wise lift chart for the best pruned tree on the test data. What is the first decile lift? Interpret this value.
Correct Answer:
Verified
b. For the default cutoff value of 0.5...
View Answer
Unlock this answer now
Get Access to more Verified Answers free of charge
Q50: To examine the local housing market in
Q51: As part of the quarterly reviews, the
Q52: To examine the local housing market in
Q53: To examine the local housing market in
Q54: To examine the local housing market in
Q56: A bank is interested in identifying different
Q57: A research team wanted to assess the
Q58: To examine the local housing market in
Q59: A research team wanted to assess the
Q60: As part of the quarterly reviews, the
Unlock this Answer For Free Now!
View this answer and more for free by performing one of the following actions

Scan the QR code to install the App and get 2 free unlocks

Unlock quizzes for free by uploading documents