The figure given below shows the demand curves for dollars arising out of Thai demand for U.S. goods and services and the supply of dollars arising out of the U.S. demand for Thai goods, services, and financial assets. D₁ and S₁ are the original demand and supply curves.?Figure 18.2
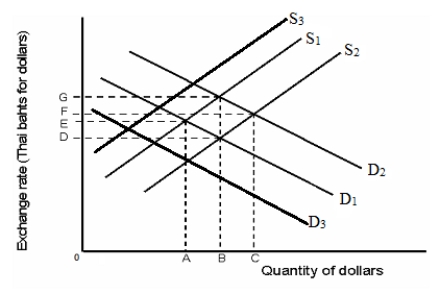
-Refer to Figure 18.2. Suppose investors predict that the value of Thai assets will decrease in the near future. This affects the current equilibrium exchange rate. To restore the original equilibrium, the Thai government intervenes in the foreign exchange market. How will this government action appear on the graph?
A) As a shift in the demand curve from D₂ to D₁
B) As a shift in the demand curve from D₁ to D₃
C) As a shift in the supply curve from S₁ to S₃
D) As a shift in the supply curve from S₁ to S₂
E) As a shift in the demand curve from D₂ to D₃
Correct Answer:
Verified
Q27: The Asian tigers have experienced rapid economic
Q38: Average growth of per capita GDP of
Q43: There are certain variables that are so
Q45: Refer to Figure 18.1.If there were a
Q45: After a speculative attack has been successful,
Q49: The figure given below shows the demand
Q50: Suppose, before the Asian financial crisis, the
Q52: The deleveraging of financial institutions led to
Q54: Which of the following resulted in the
Q58: Generally, which of the following is the
Unlock this Answer For Free Now!
View this answer and more for free by performing one of the following actions

Scan the QR code to install the App and get 2 free unlocks

Unlock quizzes for free by uploading documents