In the figure given below, D₁ and S₁ are the initial demand and supply curves for a commodity in the market.Figure 3.3
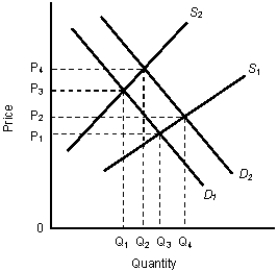
-Refer to Figure 3.3. If the change in the demand in this market occurred before the change in supply, then starting from the initial equilibrium:
A) firms would experience a fall in profits and then a gradual increase in profits after the change in supply occurred.
B) there would be an immediate shortage, lasting until the price reaches P₂.
C) price would change from P₁ to P₂ after the change in demand and would change again from P₃ to P₄ after the change in supply.
D) there would be a surplus until the price reaches P₄.
E) there would be a surplus even after price reaches P₄.
Correct Answer:
Verified
Q26: The table given below reports the quantity
Q29: The table given below reports the quantity
Q41: The figure given below shows the demand
Q43: The figure given below represents the equilibrium
Q47: The table given below reports the quantity
Q47: In the figure given below, D₁ and
Q52: The table given below represents the supply
Q53: The table given below represents the supply
Q59: The figure given below shows the demand
Q60: The table given below reports the quantity
Unlock this Answer For Free Now!
View this answer and more for free by performing one of the following actions

Scan the QR code to install the App and get 2 free unlocks

Unlock quizzes for free by uploading documents