The table below contains data for a country. The base year is 2006.
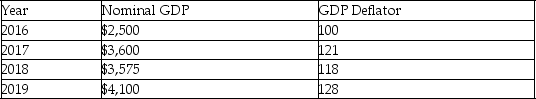
-Refer to the above table.From 2017 to 2019,inflation is ________ and output ________.
A) 5.8 percent; grew
B) 7 percent; grew
C) 9.4 percent; grew
D) 28 percent; did not grow
Correct Answer:
Verified
Q199: The GDP deflator is 100 times the
Q200: The country described in the table below
Q201: The following table contains prices and quantities
Q202: The following table contains prices and quantities
Q203: The table below shows a list of
Q205: The following table contains prices and quantities
Q206: A country's Consumer Price Index was 129
Q207: Explain the difference between the GDP deflator
Q208: Scenario: A typical resident of the country
Q209: Scenario: A typical resident of the country
Unlock this Answer For Free Now!
View this answer and more for free by performing one of the following actions

Scan the QR code to install the App and get 2 free unlocks

Unlock quizzes for free by uploading documents