(Figure: The Price Elasticity of Demand) Using the midpoint formula, calculate the price elasticity of demand between points a and b.
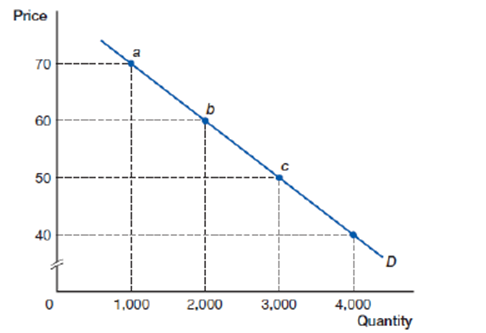
A) .007
B) 4.33
C) 1.32
D) .23
Correct Answer:
Verified
Q16: Which good is the most elastic because
Q17: Demand for more expensive items tend to
Q18: Consumers are less responsive to price increases
Q19: (Figure: The Market for Ford Mustangs) The
Q20: To overcome ambiguity related to the direction
Q22: (Figure: The Price Elasticity of Demand) Using
Q23: (Figure: The Price Elasticity of Demand) Using
Q24: Price elasticity is often expressed in terms
Q25: (Table: The Price of a Movie
Q26: (Table: The Price of a Hamburger)
Unlock this Answer For Free Now!
View this answer and more for free by performing one of the following actions

Scan the QR code to install the App and get 2 free unlocks

Unlock quizzes for free by uploading documents